
How Does BMS Track Battery Degradation Over Time?

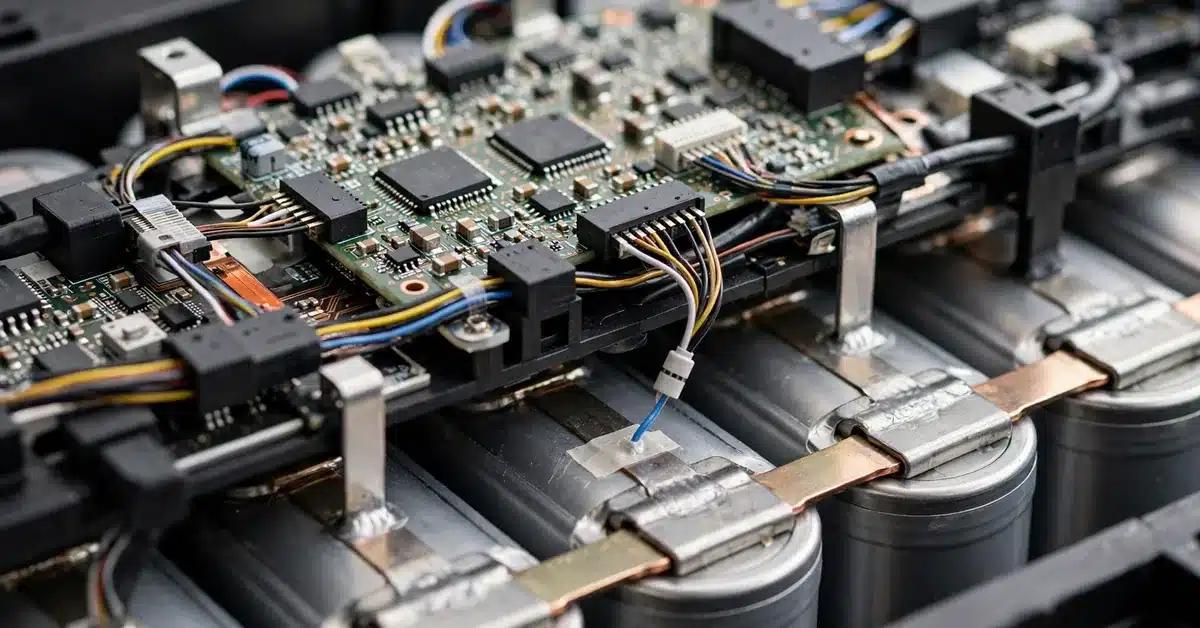
A BMS tracks battery degradation over time by logging capacity, internal resistance, and cycle count data across every charge and discharge cycle, then comparing current values against historical baselines to calculate a trend, not just a single snapshot of current health. Degradation tracking is fundamentally about watching change over time, distinct from calculating a one-time state-of-health figure.
Why Tracking Trends Matters More Than a Single Reading
A single state-of-health calculation tells you where a battery stands right now. Degradation tracking goes further, building a historical record that reveals the rate of change, whether the battery is fading gradually and predictably, or showing an accelerating decline that might indicate a developing problem worth investigating.
What Data Gets Logged for Degradation Tracking
- Capacity delivered during each full or partial charge-discharge cycle
- Internal resistance measurements taken periodically
- Cycle counts, both full-equivalent cycles and partial cycles
- Temperature history, since thermal exposure directly influences aging rate
- Time spent at various states of charge, particularly extreme high or low levels
How the BMS Builds a Degradation Curve
By comparing capacity and resistance values against the battery’s original beginning-of-life baseline at regular intervals, the BMS can plot a degradation curve over the vehicle’s life, rather than relying on any single measurement. This curve reveals whether the battery is following an expected, gradual decline or deviating from that pattern in a way that might warrant closer attention.
Why Cumulative Usage History Matters
Because degradation correlates strongly with cumulative stress, total cycles, time spent at extreme temperatures or charge levels, and exposure to high current, tracking this usage history alongside capacity data helps distinguish normal, expected aging from degradation accelerated by specific usage patterns.
How This Data Gets Used Beyond the Vehicle Itself
Informing Range Estimates
As tracked degradation reduces true usable capacity, the BMS updates its range calculations to reflect the battery’s actual current condition rather than its original specification.
Supporting Warranty Evaluation
A documented degradation history gives manufacturers concrete evidence for evaluating whether a battery’s decline falls within normal expected patterns or warrants warranty coverage.
Feeding Fleet-Wide and Cloud Analytics
When connected to manufacturer cloud systems, degradation data from individual vehicles can be aggregated to identify patterns across a model line, informing future design improvements or catching a widespread issue early.
Why Some Degradation Isn’t Linear
Lithium-ion degradation doesn’t always follow a perfectly straight-line decline; it can accelerate in later stages of life or show temporary plateaus. This is exactly why continuous tracking, rather than extrapolating from early data alone, gives a more accurate picture of a specific battery’s actual trajectory.
| Tracked Data | What It Reveals |
|---|---|
| Capacity per cycle | Direct measure of energy storage decline |
| Internal resistance trend | Power delivery capability over time |
| Cycle count history | Cumulative usage stress |
| Temperature/SOC exposure history | Context for why degradation may be faster/slower than typical |
Conclusion
A BMS tracks battery degradation over time by continuously logging capacity, resistance, and usage data across every cycle, building a historical trend rather than relying on any single measurement. This ongoing tracking is what allows the system to update range estimates accurately, support warranty evaluations with real evidence, and, when connected to broader fleet data, help manufacturers catch developing patterns across an entire model line.
FAQs
Does degradation tracking slow down as a battery gets older?
No, it continues throughout the battery’s life, since ongoing tracking remains just as important, if not more so, in later years.
Can I see my own EV’s degradation history?
Some manufacturers offer basic health data through an app or dashboard, though full historical logs are typically accessible mainly to technicians with diagnostic tools.
Does degradation tracking data help predict future battery life?
Yes, trend data is a key input for remaining-useful-life predictions, particularly when combined with more advanced modeling techniques.
