
Which EV Has the Lowest Battery Degradation Rate?

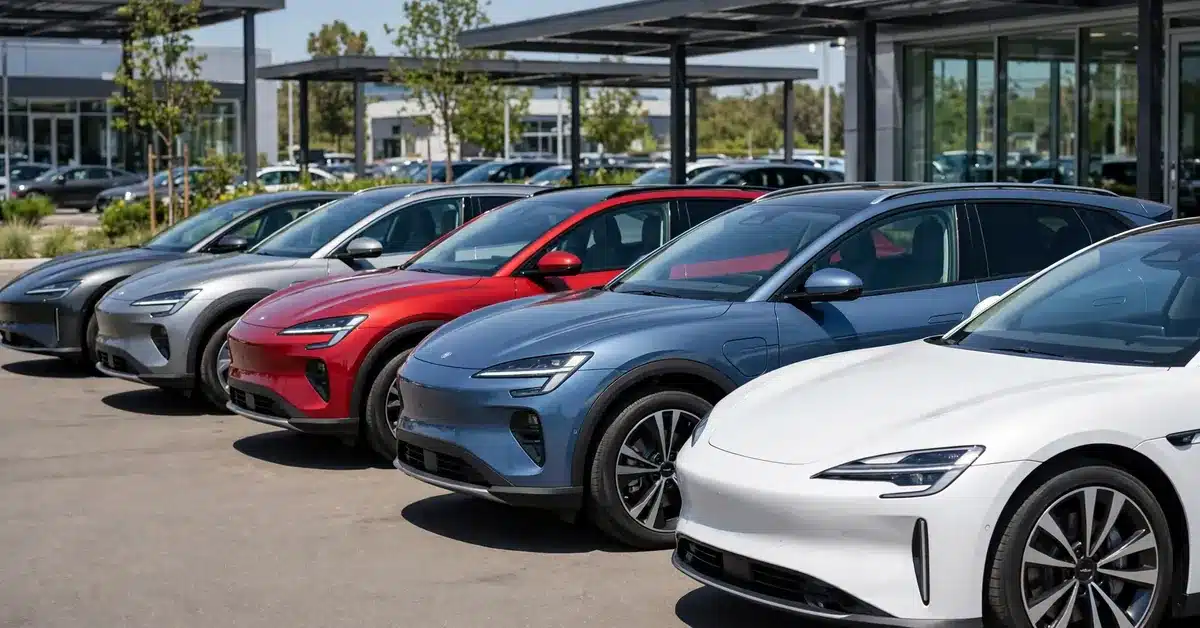
Battery degradation rates vary meaningfully between brands, models, and chemistries — not by a small margin, but often by a factor of 2 or more between the best and worst performers. This guide compares real-world fleet data to identify which EVs hold onto capacity longest, and why.
What Drives the Difference Between Brands
Three factors explain nearly all of the variation seen across brands: thermal management design (liquid-cooled packs consistently outperform air-cooled ones), battery chemistry (LFP inherently degrades slower than high-nickel NMC), and BMS software sophistication (how conservatively the system manages charging and cell balancing). For the full technical breakdown of these factors, see EV Battery Degradation Explained.
Real-World Degradation Rates by Brand/Model
| Model | Chemistry / Cooling | Typical Annual Degradation | Capacity at 100k+ Miles |
|---|---|---|---|
| Tesla Model 3/Y (LFP variants) | LFP, liquid-cooled | ~1.0–1.5% | ~90%+ |
| Tesla Model 3/Y (NMC variants) | NMC, liquid-cooled | ~1.5–2.0% | ~85% |
| Tesla Model S/X | NCA, liquid-cooled | ~1.5–2.0% | ~88% |
| Hyundai/Kia (Ioniq 5, EV6) | NMC, liquid-cooled | ~2.0% | ~84% |
| Ford Mustang Mach-E | NMC, liquid-cooled | ~2.0–2.5% | ~80% |
| Chevrolet Bolt | NMC, liquid-cooled | ~2.0% | ~82% |
| Early Nissan Leaf (pre-2018) | NMC, air-cooled | ~3.5–4.5% (hot climates) | ~65–70% |
Figures are directional averages based on aggregated fleet telematics data and vary by climate, charging habits, and individual vehicle history. See our model-specific guides for detailed data: Nissan Leaf, Chevy Bolt, Hyundai Ioniq 5, Rivian R1T, and Ford Mustang Mach-E.
Why LFP-Equipped Models Lead the Pack
LFP (lithium iron phosphate) chemistry has a fundamentally more stable cathode structure than nickel-based chemistries, translating directly into 2,000–5,000+ rated charge cycles versus 800–2,000 for typical NMC packs. LFP is also far more tolerant of being charged to 100% daily without accelerated wear — a practice that actively damages NMC packs over time. As LFP adoption expands beyond entry-level trims into mainstream and even premium vehicles, the average degradation rate across the entire EV market is trending downward. See LFP vs NMC Batteries for the full chemistry comparison.
Why Cooling System Design Matters as Much as Chemistry
The single clearest example in the data is the early Nissan Leaf, which used the same general chemistry family as many well-performing EVs but paired it with no active liquid cooling. In hot climates, this resulted in degradation rates roughly double what liquid-cooled competitors experienced with similar chemistry. Every mainstream EV launched in the past several years uses liquid cooling, which is why current-generation vehicles across virtually all brands cluster much more closely together in degradation rate than older models did.
How to Use This Information When Shopping
If long-term battery retention is a priority, look specifically for LFP-equipped trims where available, confirm the vehicle uses active liquid cooling (standard on nearly everything sold today except some older used models), and check independent fleet degradation data for the specific model year — since even within a single nameplate, battery suppliers and BMS software can change meaningfully between model years.
Conclusion
LFP-equipped, liquid-cooled EVs currently show the lowest real-world degradation rates, commonly retaining 90%+ capacity well past 100,000 miles. The gap between the best and worst performers has narrowed significantly as liquid cooling became standard across the industry, but chemistry choice still creates a measurable difference — making LFP the strongest single indicator of long-term battery retention when comparing otherwise similar vehicles.
